Giving to nonprofits in the United States plunged during 2022, led by the disappearance of individual donors. Giving dropped to an estimated $499.33 billion – down 3.4% in current dollars and 10.5% after adjusting for inflation from a revised total of $516.65 billion in 2021.
Giving also declined as a percentage of the nation’s gross domestic product, to 1.9% from 2.2%.
Inflation, economic uncertainty, individuals returning to previous giving levels after the pandemic surge and the decline in the number of donors are the key culprits in the drop, according to researchers for Giving USA 2023: The Annual Report on Philanthropy for the Year 2022. It is published by Giving USA Foundation, part of The Giving Institute. It is researched and written by the team at Indiana University Lilly Family School of Philanthropy at Indiana University.
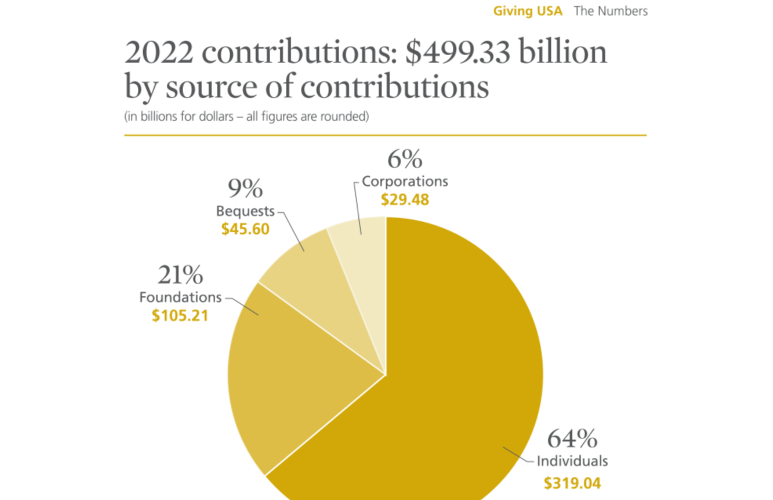
Donations by individuals declined significantly as a portion of overall giving, to 64% from 66% during 2021. Individuals provided $319.04 billion in support, a decline of 6.4% in 2022 and 13.4%, when adjusted for inflation. In current dollars that’s $319.04 billion during 2022 versus $340.97 billion in 2021.
Foundation giving was $105.21 billion, up 2.5% but down 5% in inflation-adjusted dollars. It made up 21% of all giving. Bequests hit $45.60 billion, up 2.3% but down 5.3% in inflation-adjusted dollars. It made up 9% of all giving. Corporations gave $29.48 billion, up 3.4% but down 4.2% after adjusting for inflation. It was 6% of all giving.
In current dollars, total charitable giving increased 6.2% between 2020 and 2021 and decreased 3.4% between 2021 and 2022. The cumulative change in current-dollar total giving between 2020 and 2022 was 2.7%, according to the new data.
“Nonprofits and donors alike experienced the steady, negative impacts of inflation, such as the growing cost of goods and high interest rates throughout 2022, and many of those challenges remain,” said Amir Pasic, Ph.D., the Eugene R. Tempel Dean of the Lilly Family School of Philanthropy. “However, Giving USA’s historical data also provide a case for hope: we have seen charitable giving rebound from each decline.”
As usual, giving to religion took the top spot at $143.57 billion (27% of total amount donated), followed by:
* Human services – $71.98 billion (14%)
* Education – $70.07 billion (13%)
* Gifts to grant making foundations – $56.84 billion (11%)
* Health – $51.08 billion (10%)
* Public-Society Benefits – $46.86 billion (9%)
* International Affairs – $33.71 billion (6%)
* Arts, Culture & Humanities – $24.67 billion (5%)
* Environmental/Animals – $16.10 billion (3%)
* Giving To Individuals – $12.98 billion (2%)
Seven of the nine sector-related categories declined when inflation-adjust dollars were calculated. Only international affairs (up 2.7%) and foundations (1.95%) were in positive territory. Unallocated giving was negative $28.54 billion in 2022. This amount is the difference between giving by source and use (who received it) in a particular year. This amount includes the difference between itemized deductions by individuals (and households) carried over from previous years. The tax year in which a gift is claimed by the donor (carried over) and the year when the recipient organization reports revenue (the year in which it is received) might be different.
Public-society benefit got hit hardest. Giving to public-society benefit increased 11.8% in inflation-adjusted dollars between 2020 and 2021. Between 2021 and 2022, inflation-adjusted giving to public-society benefit declined by 15.2%. The cumulative change in giving to public-society benefit between 2020 and 2022 is negative 5.1% in inflation-adjusted dollars.
“I think there are a lot of silver linings in the data. The good news here is when we shared the findings, most people who had been paying attention to the economic data were not surprised,” said Una Osili, Ph.D., Associate Dean for Research and International Programs; Efroymson Chair in Philanthropy; Dean’s Fellow, Mays Family Institute on Diverse Philanthropy at the Lilly Family School of Philanthropy.
Some of the data she referenced includes year-over-year inflation, the rate at which consumer prices increase, which was 6.5% in December 2022, the Federal Reserve raising interest rates seven times during 2022 and again on February 1, 2023. Most important when looking at donor behavior is that when accounting for inflation, workers’ average hourly earnings were down 1.7% in December 2022 compared to a year prior.
The total estimate for giving by individuals in 2022 included itemized and non-itemized charitable contributions. Contributions included gifts of cash, securities and property. Mega-giving from six individuals, such as MacKenzie Scott, and couples totaled $13.96 billion during 2022.
One of those not surprised by the drop in giving is Woodrow Rosenbaum, chief data officer for GivingTuesday and a non-resident fellow, Technology and Public Purpose Project at the Belfer Center at the Harvard Kennedy School.
“There may be other factors as well, but the dominant trend has been for nonprofits to focus on large donor stewardship at the expense of everything else, and for lots of good reasons, as well as some that might be misguided. This is what we would expect to see” when affluent donors pull back, Rosenbaum said.
“I think it has more to do with the pressing need in the nonprofit sector for short term dollars. It has driven us toward that at the expense of other activity combined with some scarcity mentality that contributes to continuing that cycle,” said Rosenbaum. “It works to get more money until you have too many eggs in that one basket and then have some type of correction which appears is what happened last year.”
That sentiment of smaller donors not being asked is key to the decline, according to Shannon McCracken, CEO of the Nonprofit Alliance in Washington, D.C. “What the nonprofit sector inherently knows – but donors and the general public may not consider in seeing Giving USA 2023 highlights – is that increases in giving from corporations, foundations and mega-donors that help cover declines in individual giving on a pie chart are not equally distributed,” she said. “There are winners and losers. Institutional funders can be magnificent change-makers, but the everyday givers are the bedrock of democracy of giving.”
Chris Pritcher, CEO at national fundraising firm RKD Group in Dallas, believes charities leaders must fundamentally change their pursuit of donors. “This study is the latest in a series of alarm bells, but it doesn’t even touch what might be the loudest alarm. I’m bothered by the fact that individual giving revenue is down 6.4%, but I’m more concerned that the number of donors continues to decline,” he said in reaction to the data.
“Not enough people are being moved to contribute – because our practices perpetuate talking at them, not talking with them or listening to them,” said Pritcher. “As a sector, we have to change. We must work harder than ever to innovate and deepen relationships with donors, no matter how much they give.”
McCracken offered additional perspective when it comes to rank and file donors. “For the last 10-plus years, there’s been a substantial shift in donor acquisition best practices to maximize efficiency by focusing on donors with the highest lifetime value,” said McCracken. “The natural follow-up question for nonprofits is whether that efficiency of fundraising for the years leading up to 2022 was worth it – that is, are they in a better financial position at present, with the 2022 softening, than they would be had they continued to prioritize the number of donors over gift size? If yes, that’s an intriguing context to overlay on the Giving USA data. If the answer is no, these numbers may inspire new definitions of fundraising efficiency.”
Rosenbaum believes the cash is out there. “Theoretically, there is some limit to how much someone can give but there’s so much elasticity in the donor ecosystem that we are nowhere near that limit,” he said.
Gifts via donor-advised funds (DAFs) are becoming more popular, especially in times when holders of such accounts believe they can’t deposit as much into the accounts and therefore feel the need to grant more from the DAFs, said Rosenbaum.
It is hard to track the impact of DAFs in the Giving USA numbers. DAF funds are counted wherever the organization that hosts the donor-advised fund is counted. For example, a DAF that is held within a community foundation will be counted with community foundations in the giving to foundations subsector. Freestanding, national or commercial DAFs, such as Fidelity Charitable, are counted in the Public-Society Benefit subsector on the uses side.
According to the most recent data from the National Philanthropic Trust, $72.67 billion was deposited into DAFs and $45.74 billion was granted during 2021. The average DAF account was $183,842.
In addition, other types of organizations on the uses side sponsor DAFs. The contributions to these donor-advised funds appear in Giving USA in the specific subsector under which the primary organization is categorized. Some examples are DAFs within higher education institutions (in education) and within organizations such as World Vision (in international affairs), the Humane Society (in environment/animals) or the National Christian Foundation (in public-society benefit).
Americans continued remembering charities in their wills. Giving by bequest has captured between 7% and 9% of total giving during the past 40 years, with high points in the five-year periods beginning in 1993, 1998, 2013 and 2018, the data show. Giving by bequest saw its largest period of growth during the five-year period beginning in 1998, with an increase of 40.7%.
Many nonprofit advocates want to ensure living Americans have an incentive to give. “Nonprofits leaders and policymakers should be alarmed that the 2022 decline in donations from individuals illustrates the impact of a 20-year decline in the percentage of Americans who donate to nonprofits,” said Steve Taylor, a principal at public policy firm Integer in Washington, D.C.
“In 2000, two-thirds of American households gave. By 2018, that percentage had fallen to less than half of households,” said Taylor who spent more than 15 years at United Way Worldwide, most recently as senior vice president and counsel for public policy.
A coalition of nonprofits and others are working to reverse this trend by asking Congress to allow all taxpayers who donate to deduct those gifts from their taxes. “Since 2018, only about 10% of taxpayers have been able to take the deduction, with the exception of the $300/$600 non-itemizer deduction in place in 2020 and 2021,” said Taylor. “While renewing and expanding this deduction is just part of a solution, virtually all the empirical evidence shows that tax deductibility increases donations.”
More troubling is when these numbers are paired with earlier research from the Lilly School that showed just 5.4% of American believe they had a personal interaction with a nonprofit – despite more than 10% of the population working at a nonprofit and tens of millions of people involved with organizations such as YMCAs, YWCAs and scouting.
“The Giving USA results should be a bit of a reminder or maybe a nudge if not a direct catalyst for a lot of folks around the philanthropic sector to recognize and think about the importance of engagement and building those authentic relationships,” said Osili.
Giving USA estimates primarily rely on econometric methods developed by researchers in philanthropy and the nonprofit sector and are reviewed and approved by members of the Giving USA External Review Panel. Members of the External Review Panel include research directors from national nonprofit organizations as well as scholars from such disciplines as economics and public affairs, all of whom are involved in studying philanthropy and the nonprofit sector.
The Indiana University Lilly Family School of Philanthropy prepares all of the estimates in Giving USA for the Giving USA Foundation. Giving USA develops estimates for giving by each type of donor (sources) and for recipient organizations categorized by subsectors (uses). Most of Giving USA’s annual estimates are based on econometric analyses and tabulations of tax data, economic indicators and demographics.
Data for giving by foundations come from Candid (formerly the Foundation Center). Giving USA researchers update data found within Giving USA each year. This is because current Giving USA estimates are developed before final tax data, some economic indicators and some demographic data are available. The estimates are revised and updated as final versions of these data become available. Final estimates are usually developed two or three years after their initial release.